
In this blog post, we’ll break down the SQL query provided and explain how it calculates essential statistics—namely the median, average, and range of sale prices—across four cities in Ontario: London, Waterloo, St. Thomas, and St. Catharines. The query uses window functions and aggregation to provide insightful data about the real estate market trends in these regions.
1. Understanding the Structure of the Query
The query consists of several parts, each of which corresponds to one of the four cities. Let’s start by analyzing how the query calculates the statistics for each city.
2. Using Window Functions for Sorting and Row Numbering
The first part of the query defines a Common Table Expression (CTE) for each city. Each CTE is named according to the city (e.g., SortedSalesPriceLondon, SortedSalesPriceWaterloo, etc.). Inside each CTE, the query calculates two important things using window functions:
- Row Number: ROW_NUMBER() OVER (ORDER BY [Sale Price]) AS RowNum—This function assigns a unique number to each row in the sorted list of sale prices for each city. The rows are ordered by sale price, allowing us to pinpoint the median and other percentiles.
- Total Count: COUNT(*) OVER () AS TotalCount—This calculates the total number of sale price records in each city, which is necessary for determining the median.
Here’s an example of the SortedSalesPriceLondon CTE:
WITH SortedSalesPriceLondon AS (
SELECT
[Sale Price],
ROW_NUMBER() OVER (ORDER BY [Sale Price]) AS RowNum,
COUNT(*) OVER () AS TotalCount
FROM [dbo].[London_Ontario]
)
This snippet orders the sale prices in ascending order and assigns row numbers to each record while also counting the total records.
3. Calculating Median Sale Price
The median is the middle value of a sorted data set. If there is an odd number of records, the median is the middle row, and if there is an even number of records, the median is the average of the two middle rows. The query handles both scenarios by checking for row numbers that fall within the middle of the dataset.
For each city, the query selects the rows with RowNum values that correspond to the middle of the dataset:
WHERE RowNum IN ((TotalCount + 1) / 2, (TotalCount + 2) / 2)
This ensures that it picks the two middlemost values and calculates their average to get the median.
4. Calculating Other Sale Price Statistics
Along with the median, the query also calculates the following:
- Average Sale Price: This is calculated using AVG([Sale Price]), providing the mean sale price for the entire dataset in each city.
- Minimum and Maximum Sale Price: The query calculates the minimum and maximum sale prices for each city using MIN([Sale Price]) and MAX([Sale Price]), which gives us the price range in each city.
5. Combining Results for All Cities
After calculating these statistics for each city individually, the results are combined into a single output using the UNION ALL operator. This combines the results from the four cities into one final result set.
Here’s an example of the query for London:
SELECT
‘London’ as City,
AVG([Sale Price]) AS MedianSalePrice,
(SELECT AVG([Sale Price]) FROM [dbo].[London_Ontario]) AS AverageSalePrice,
(SELECT Min([Sale Price]) FROM [dbo].[London_Ontario]) AS MinSalePrice,
(SELECT Max([Sale Price]) FROM [dbo].[London_Ontario]) AS MaxSalePrice
FROM SortedSalesPriceLondon
WHERE RowNum IN ((TotalCount + 1) / 2, (TotalCount + 2) / 2)
This is repeated for each of the other cities (Waterloo, St. Thomas, and St. Catharines), allowing for an apples-to-apples comparison across the regions.
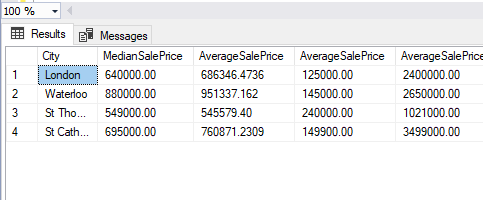
6. Expected Output
The query returns the following columns for each city:
- City: The name of the city (London, Waterloo, St. Thomas, St. Catharines).
- Median Sale Price: The average of the two middlemost sale prices in the sorted list.
- Average Sale Price: The mean sale price across all records in the city.
- Min Sale Price: The lowest sale price in the dataset for that city.
- Max Sale Price: The highest sale price in the dataset for that city.
Complete Code
WITH SortedSalesPriceLondon AS (
SELECT
[Sale Price],
ROW_NUMBER() OVER (ORDER BY [Sale Price]) AS RowNum,
COUNT(*) OVER () AS TotalCount
FROM [dbo].[London_Ontario]
),
SortedSalesPriceWaterloo AS (
SELECT
[Sale Price],
ROW_NUMBER() OVER (ORDER BY [Sale Price]) AS RowNum,
COUNT(*) OVER () AS TotalCount
FROM [dbo].[Waterloo_Ontario_Last_6Month]
),
SortedSalesPriceStThomas AS (
SELECT
[SPrice],
ROW_NUMBER() OVER (ORDER BY [SPrice]) AS RowNum,
COUNT() OVER () AS TotalCount FROM [dbo].[StThomas] ), SortedSalesPriceStCatherines AS ( SELECT [Sold Price], ROW_NUMBER() OVER (ORDER BY [Sold Price]) AS RowNum, COUNT() OVER () AS TotalCount
FROM
[dbo].[StCatherines1])
SELECT
‘London’ as City,
AVG([Sale Price]) AS MedianSalePrice,
(SELECT AVG([Sale Price]) FROM [dbo].[London_Ontario]) AS AverageSalePrice,
(SELECT Min([Sale Price]) FROM [dbo].[London_Ontario]) AS AverageSalePrice,
(SELECT Max([Sale Price]) FROM [dbo].[London_Ontario]) AS AverageSalePrice
FROM SortedSalesPriceLondon
WHERE RowNum IN ((TotalCount + 1) / 2, (TotalCount + 2) / 2)
Union all
SELECT
‘Waterloo’ as City,
AVG([Sale Price]) AS MedianSalePrice,
(SELECT AVG([Sale Price]) FROM [dbo].[Waterloo_Ontario_Last_6Month]) AS AverageSalePrice,
(SELECT Min([Sale Price]) FROM [dbo].[Waterloo_Ontario_Last_6Month]) AS AverageSalePrice,
(SELECT Max([Sale Price]) FROM [dbo].[Waterloo_Ontario_Last_6Month]) AS AverageSalePrice
FROM SortedSalesPriceWaterloo
WHERE RowNum IN ((TotalCount + 1) / 2, (TotalCount + 2) / 2)
Union all
SELECT
‘St Thomas’ as City,
AVG([SPrice]) AS MedianSalePrice,
(SELECT AVG([SPrice]) FROM [dbo].[StThomas]) AS AverageSalePrice,
(SELECT Min([SPrice]) FROM [dbo].[StThomas]) AS AverageSalePrice,
(SELECT Max([SPrice]) FROM [dbo].[StThomas]) AS AverageSalePrice
FROM SortedSalesPriceStThomas
WHERE RowNum IN ((TotalCount + 1) / 2, (TotalCount + 2) / 2)
Union all
SELECT
‘St Catherines’ as City,
AVG([Sold Price]) AS MedianSalary,
(SELECT AVG([Sold Price]) FROM [dbo].[StCatherines1]) AS AverageSalePrice,
(SELECT Min([Sold Price]) FROM [dbo].[StCatherines1]) AS AverageSalePrice,
(SELECT Max([Sold Price]) FROM [dbo].[StCatherines1]) AS AverageSalePrice
FROM SortedSalesPriceStCatherines
WHERE RowNum IN ((TotalCount + 1) / 2, (TotalCount + 2) / 2)
;